Sql Server : How are these two rollbacks different?
- Posted by Sqltimes
- On August 12, 2015
- 0 Comments
Interesting topic today:
Ran into a situation, for which, I could not find a better explanation. If anyone has a better idea or proof, please share with me.
If it matters, the following tests are run on Sql Server 2008 R2.
Question:
Are these two Rollbacks different?
Scenario 1: Run an ALTER table statement on a very large table. Obviously, it takes a long time. Half way through the progress, hit “Cancel Executing Query” button. Since a lot of work has been performed, Sql Server will try to rollback that work. Since rollback is single threaded it takes a long while.
|
1
2
3
4
5
|
---- Changing the column size from 10 to 100 (takes a lot of time, based on the number of records in the table)--ALTER TABLE dbo.SampleTable ALTER COLUMN SomeColumn NVARCHAR(100)GO |
Scenario 2: Run the same ALTER statement, on the same large table, but this time make sure the LDF file is not large enough to support the full execution of the command. Also, disable “autogrowth”. At some point, the execution hits a wall (out of disk space) and performs a rollback and stops running instantaneously. You’ll see the error below:
The statement has been terminated
Msg 9002, Level 17, State 4, Line 1
The transaction log for database 'SampleDB' is full.
To find out why space in the log cannot be reused, see the log_reuse_wait_desc column in sys.databases
So the question is:
- How are these two rollbacks different? One is instantaneous and the other takes a LONG time to rollback.
- What happens behind the scenes that makes these two different?
- Why is the log file usage varies so much? Some times it increases and then decreases and then increases again. This happens a few times; Why?
- Log usage is measured using DBCC SQLPERF(LOGSPACE)
Conjecture
As of now, I do not have a clear explanation as to why this is. But following are my estimations based on the artifacts gathered during the tests.
- Rollback happens in both scenarios.
- One is explicit rollback (user hitting Cancel button), the other is implicit (Sql Server making that decision internally).
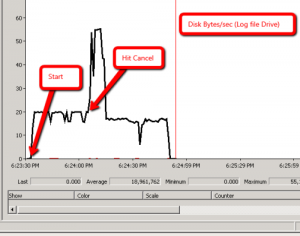
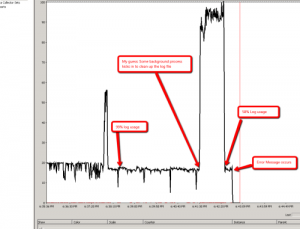
- In both scenarios, the traffic going to the log file is consistent. See the images below:
- Scenario 1:
-
- Scenario 2:
- One artifact that reinforced this line of thinking is capturing Sql Trace during both the scenarios.
- Scenario 1 is self evident a.k.a. when we hit ‘Cencel’, it rolls back.
- In Scenario 2, the error message is displayed after performing ‘rollback’ implicitly. In Sql Trace, we see the error message “The transaction log for database ‘SampleDB’ is full” a long time before the message is displayed on the screen. So, my guess is that rollbacks happens in both scenarios, but the error message is Scenario 2 is displayed after successfully and completely performing the rollback.
- Scenario 2 seems to take longer as as it progresses much further along, so the rollback takes longer.
Unexplained behavior
- Why does the log file usage vary so much. It increases to 90%, then down to 85%, then up to 99% and hovers there for a long time. I see it going up and down like this several times: 99.2 %, 99.8 %, 99.1 %, 99.7 %. Why does this happen?
- One possible explanation is that, there might be a background process (something like Log Flush) that cleans up log file every few minutes. And everytime it kicks in, some entries are cleared up, resulting in more free space available.
Any ideas to help explain this behavior in a better way are welcome.
Hope this helps,
_Sqltimes


0 Comments