Sql Server : Use Performance Monitor to capture Sql Server resource consumption metrics
- Posted by Sqltimes
- On June 1, 2015
- 0 Comments
There are several ways to measure, capture & analyze meta to fully map out Sql Server performance on a given server (hardware). Regularly capturing this data allows identifying trends of resource consumption and helps in Capacity Planning.
PerfMon (Performance Monitor) has Data Collectors that allow us to capture good meta-data. Operating System calculates this data all the time and this tool allows us to capture that data into a text file with minimal overhead.
Following sections show the configuration steps:
Step 1 : Create a Data Collector Set
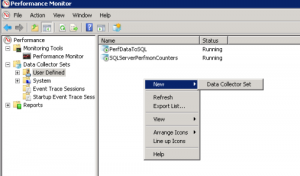
Open PerfMon and go to ‘Data Collector Sets’. Highlight ‘User Defined’ section; In the right panel, right click >> New >> click on ‘Data Collector Set’.
Step 2 : Create a Data Collector Set
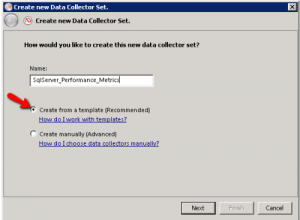
In the next window, give a name to this collector and choose ‘Create from a template’ option.
Step 3 : Configure the metrics
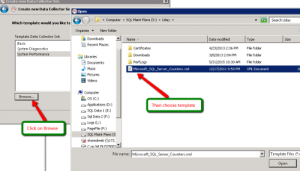
Microsoft has a standard template for capturing metrics for Sql Server. Use that xml file for PerfMon. See the image below.
Step 4 : Save into a file
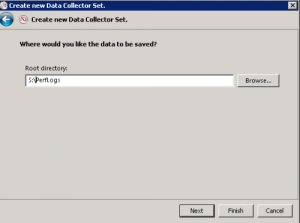
In the next screen, save the metrics into a text file. Make sure you save it into a non-data drive on the machine. Either to a maintenance drive or something that is not actively used by Sql Server. This process does not need much resources, but to be safe, save the file on to maintenance drive.
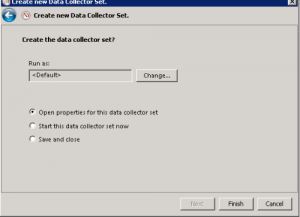
Step 5 : Save and Go to properties
Choose ‘Open properties for this data collector set’ and hit Finish.
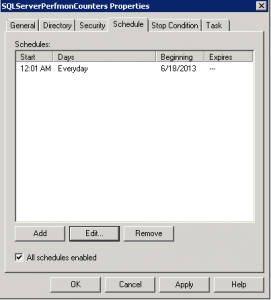
Step 6 : Schedule
In properties window, under ‘Schedule’ tab, click ‘Add’ and create a schedule. Try to run it all day every day, so you have a clear picture of underlying performance day after day for better trend analysis.
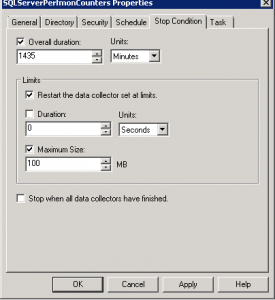
Step 7 : Stop Condition (just in case)
Under ‘Stop Condition’ tab, set up the maximum file size to be sure the file does not get too big. Also configure the ‘Overall Duration’ to make sure it runs only for 24 hours at a time. After each day, a new file is created.
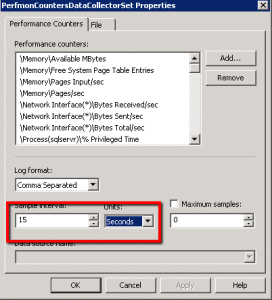
Step 8 : Configure Frequency
Hit ‘Apply’ in above step. Under ‘User Defined’ section, highlight the new data collector. On the right panel, highlight the performance counter. Right click and go to properties. Under ‘Performance Counters’ tab, select the frequency that you’d like to capture this data. Anything between 5 seconds to 1 minute is okay, depending on the situation.
For troubleshooting situation, may be once every 5 seconds could help. During normal operations, once every 1 minute is okay too.
Step 9 : Run it and voila
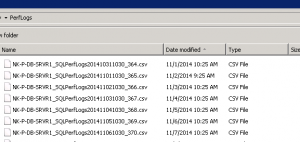
Go back to ‘User Defined’ section in ‘Data Collector Sets’ and highlight the new collector. Right click and hit ‘Start’. If all goes well, a new file is created in the ‘S:\PerLogs\’ folder with data for all the metrics.
Hope this helps,
_Sqltimes

0 Comments